|
 |
 |
 |
 |
 |
|
|
Animal Trait Correlation Database |
|
|
Frequently Asked Questions
|
| ||||||||||||
| |||||||||||||
|
| |||||||||||||
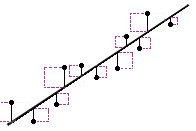
Correlation is a statistical method that can show whether and how strongly
changes of pairs of variables (such measurements of animal traits) are related.
Genetic and phenotypic trait correlation studies have been conducted for decades
since Hazel proposed the methods in 1943.
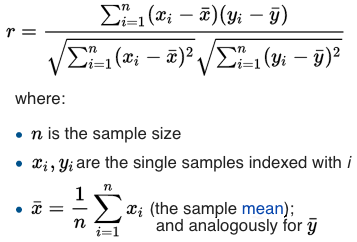
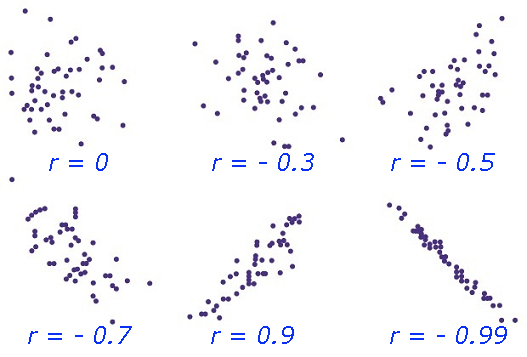
Correlation Coefficient (r) is a statistical parameter that describes the degree as how closely the pairs of variables are related.
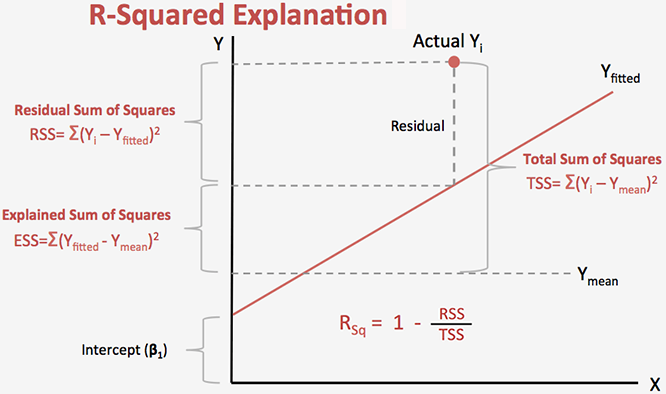
R-square: The square of the coefficient
(
 , also known as
"coefficient of determination") is equal to the percent of the variation
in one variable that is related to the variation in the other,
= Explained variation / Total variation , also known as
"coefficient of determination") is equal to the percent of the variation
in one variable that is related to the variation in the other,
= Explained variation / Total variation
 )
are normally reported as a value between -1 and +1, r-square is always between 0 and 100%.
E.g. After squaring r, ignore the decimal point. An r of .5 means 25% of the variation is
related (.5 squared =.25). An r value of .7 means 49% of the variance is related (.7
squared = .49). )
are normally reported as a value between -1 and +1, r-square is always between 0 and 100%.
E.g. After squaring r, ignore the decimal point. An r of .5 means 25% of the variation is
related (.5 squared =.25). An r value of .7 means 49% of the variance is related (.7
squared = .49).
For genetic analysis, the geneticists partition the correlation into phenotypic correlations
and genetic correlations.
The phenotypic correlation is the correlation between records of two traits
on the same animal and is usually estimated by the product-moment correlation
statistic (or Pearson correlation coefficient, for short).
The genetic correlation is the correlation between an animal's genetic value for one trait and the same animal's genetic value for the other trait.
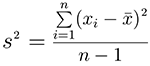
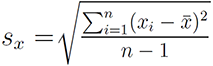
In order to correctly estimate the trait correlations, it is necessary to understand
the trait measurement variations of a trait (NB: singular, 1 trait). Statistically
the trait variation is measured by variance. The variance is a numerical
measure of how the data values is dispersed around the mean. In particular, the sample
variance is defined as:
Phenotypic variance is simply the observed, measured variance in a trait.
Its estimates is the sum of total genetic variance, non-genetic variance, and
possibily the interactions of the two factors.
VP = VG + VE + VGE
where VP = total phenotypic variation
VG = total genetic factor variation
VE = total environmental factor variation
VGE = genetic X environmental factor interaction variation
Genetic variance = additive genetic variance
+ dominant genetic variance
+ epestatic genetic variance
+ interaction between/among all previous genetic variances
Non-genetic variance = variances due to environmental factors + Error.
Genetic variations may come from Additive Genetic Variations (VA),
Dominance Variations (VD), and Epistatic Variations, or
Interaction Genetic Variations (VI). VD and VI
are called Non-Additive Genetic Variations. Thus:
VG = VA + VD + VI
∴ VP = VA + VD + VI + VE + VGE
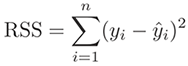
Residual is a statistical concept, representing the difference between
the observed value of the dependent variable (y) and the predicted value (ŷ)
(Residual = Observed – Predicted). The Residual Sum of Square (RSS), also
called the sum of squared errors of prediction (SSE), is a measure of the
discrepancy between the data and an estimation model.
Residual variance is also a statistical concept, representing un-explained variations (versus explained variations attributable to additive, dominance, or epistatic genetic variations). In classical genetic analysis, the residual variance is often conveniently used to represent environmental variations, referring to "everything else" after the explained variations. It is worth to note that, in a more resent study, Huang and Mackay (2016) showed evidences to indicate that variance component analysis should not be used to infer genetic architecture of quantitative traits.
H2 = VG / VP
This is called heritability in the broad sense
because it is a rather crude measure that includes reasons for the genetic
variation that are not necessarily passed on to the next generation.
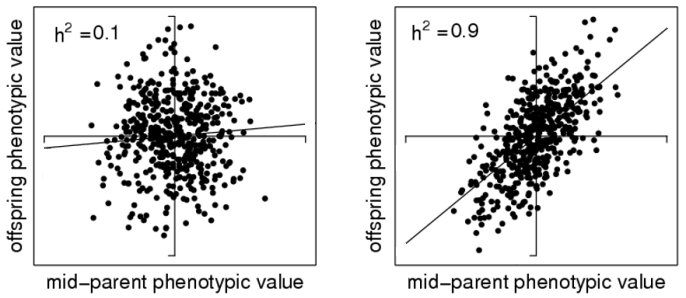
Narrow sense heritability gives the ratio of additive genetic variance/ phenotypic variance:
h2 = VA / VP
The reason why the additive genetic variance matters here is because what's passed
on to the next generation are only the alleles (NOT the dominance interaction NOR
the epistatic interaction). The allele sets to be passed on are formed newly at
each generation. For example, at generation one, some offspring may have alleles
A1/A3 and B2/B4. They are new combinations not seen in either parent, therefore the
dominance and epistatic interactions will be new. In general, greater the additive
genetic variability VA in a population, greater the diversity it, thus
greater selection potentials (greater the narrow-sense heritability);
There could have been a confusion between "environmental veriance" and "residual
variance" as they both serve as "the other", or "everything else", less important
variance component when study focus is mostly on genetic variances. Although
"environmental veriance" and "residual variance" may pretty much overlap, they
are not the same. The "environmental veriance" is a genetic concept (or method
for variance partitions), whereas the "residual variance" is a statistical concept
(or method for variance partitions).
It is not uncommon to see in publications that some only report "genetic + environment", and some others report "genetic + residual" variances. When they are curated into the CorrDB, we record they as they are (i.e. "residual" variance into a "residual" field and "environment" variance into a "environment" field. It will be up to users how these data will be looked at.
Genomic heritability (or
 g): the proportion of variance of a trait that can be
explained (in the population) by a linear regression on a set of markers. Depending on
the types of marker used, there can be SNP-based, Indel based, on methods
there can be GCTA based heritability estimates. (GCTA - Genome-wide Complex
Trait Analysis.) When a set of SNPs chosen reaching genome-wide significance for
evidence of association with the trait, the heritability is sometimes known as
GWAS. g): the proportion of variance of a trait that can be
explained (in the population) by a linear regression on a set of markers. Depending on
the types of marker used, there can be SNP-based, Indel based, on methods
there can be GCTA based heritability estimates. (GCTA - Genome-wide Complex
Trait Analysis.) When a set of SNPs chosen reaching genome-wide significance for
evidence of association with the trait, the heritability is sometimes known as
GWAS.
SNP-based heritability (or
One can estimate the relationships between individuals based on their genotypes and use a
linear mixed model to estimate the variance explained by the genetic markers. This gives
a genomic heritability estimate based on the variance captured by common genetic variants.
Other types of estimates include using GCTA approch (
GCTA), among others.
All in all, various types of heritability come from our dissection of inheritable genetic elements each of which contributes to the total heritability in general terms. e.g. h2g ≤ h2 ≤ H2
Yes, the CorrDB supports dbxref to facilitate universal links with specific CorrID. This facility was introduced in 2020 that provides links to each correlation and heritability record in the CorrDB. The syntax for the specific URL link is in the form of
https://www.animalgenome.org/CorrDB/q?id=[CorrID], where CorrID is a numeric stable ID for each correlation record in the CorrDB. This is often used by web tools, API tools, or database dbxref references. There is a section for Animal CorrDB in the GeneOntology db-xrefs list to describe the syntax to use in order to establish stable links to CorrDB.
| |||||||||||||
|
First draft: January 9, 2018 Last update: January 04 2024 23:10:17. |
By Zhiliang Hu CorrDB Developer Associate Scientist Dept of Animal Science Iowa State University | ||||||||||||
|
References
Hazel, L.N. (1943), The Genetic Basis for Constructing Selection Indexes. Genetics. 1943 Nov; 28(6): 476–490. doi: 10.1093/genetics/28.6.476. Douglas S. Falconer, Trudy F.C. Mackay (1996), Introduction to Quantitative Genetics. Published by Pearson, Edinburgh Gate, Harlowm Essex CM20 2JE, England. Wen Huang and Trudy F.C.Mackay (2016), "The Genetic Architecture of Quantitative Traits Cannot Be Inferred from Variance Component Analysis". PLoS Genet. 12(11). Peter M. Visscher, William G. Hill and Naomi R. Wray, (2008), "Heritability in the genomics era — concepts and misconceptions". Nat Rev Genet. 9(4):255-66. Jian Yang, Jian Zeng, Michael E Goddard, Naomi R Wray & Peter M Visscher (2017), "Concepts, estimation and interpretation of SNP-based heritability". Nature Genetics, 49:1304–1310. John Stanton-Geddes, Jeremy B. Yoder, Roman Briskine, Nevin D. Young, and Peter Tiffin (2013), "Estimating heritability using genomic data". Methods in Ecology and Evolution, 4:1151–1158. Raymond Walters with contributions from Claire Churchhouse and Rosy Hosking (2017). "Heritability 201: Types of Heritability and How We Estimate It". Web page last visited on April 14, 2022 at address: http://www.nealelab.is/blog/2017/9/13/heritability-201-types-of-heritability-and-how-we-estimate-it. John Hunt and Leigh W. Simmons. (2002). "The genetics of maternal care: Direct and indirect genetic effects on phenotype in the dung beetle Onthophagus taurus". Proc Natl Acad Sci U S A. 2002 May 14; 99(10): 6828–6832. | |||||||||||||
|
|
© 2003-2025:
USA · USDA · NRPSP8 · Program to Accelerate Animal Genomics Applications.
|
| |
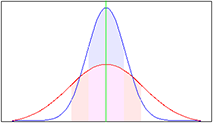
 the variance. As a measure of spread, given the mean and SD of a normal distribution,
it is possible to compute the percentile rank associated with a score.
the variance. As a measure of spread, given the mean and SD of a normal distribution,
it is possible to compute the percentile rank associated with a score.