Preferred Answers
- What are QTL/GWAS?
This graph is modified from the
Rat GDB with a kind
permission
|
Quantitative Trait Loci (QTL) are tested hypotheses that specific
chromosomal regions contain genes that make a significant contribution to
the expression of a complex trait. Hypothesized QTL are supported with,
or generally identified by, analyzing or comparing the linkage (degree of
co-variation) of polymorphic molecular markers and variation of phenotypic
trait measurements. The methods to localize a QTL includes whole genome
scan of linkage between genetic markers and phenotypes with specific
family structure designed for such analysis, and association analysis of
markers (e.g. SNPs) with certain traits (e.g. genome wide association
analysis, GWAS). Therefore, as a matter of fact they are genomic mappings
of traits. On this database site, they are interchangeably called "QTL",
"QTL/(SNP)associations".
The ultimate goal of complex trait dissection is to identify the actual
genes involved in the trait and to understand the cellular roles and
functions of these genes. Thus, the purpose of the Animal QTLdb is to
provide resources and tools for QTL regions of data mining, to facilitate
the identification of such genes.
The accuracy and precision of locating QTL depends, in part, on the
density of the linkage map created. The higher the density of the map, the
more precise the location of the putative QTL. When QTL can be mapped to
a relatively small chromosomal region or regions other methods, such as
positional cloning, can be used effectively to isolate specific genes.
Unfortunately, the denser the map, the more likely that false positive
QTL will be detected with linkage map-based QTL methods. More precise
mapping of traits is possible with newly available genome sequences and
GWAS.
Most, but not all, complex traits are affected by more than one locus.
QTL often interact in complex ways and their expression can also be
influenced by non-genetic factors. Because QTL are hypotheses, they are
subject to reinterpretation and revision. Because the location of QTL are
provisional their nomenclature is likely to be fluid and temporary.
(revised from Carol J. Bult)
- What is QTLdb? Are there any publications about it?
QTLdb is an abbreviated name for "QTL Database", which contains
published QTL/association data curated into structured tables managed in a
relational database environment, MySQL. The user and manager interface to the
database takes advantage of world-wide web (WWW) and is programmed with perl/CGI.
The active QTLdb development is a project carried out at the Iowa State
University (see this note for an overview of
its development history). The progress on the QTLdb development has been presented
at the 13th North American Colloquium on Animal Cytogenetics & Gene Mapping
(2003),
Midwestern ADSA/ASAS Annual Meeting
(2005),
annual Plant and Animal Genome (PAG) conferences (in
2005,
2006,
2007,
2008,
2009,
2011,
2012,
2015,
2016,
2018,
2020,
2022,
2023),
International Society for Animal Genetics (ISAG) (in
2008).
A number of papers by Hu et al. published on Mammalian Genome
(2005,
2007),
Nucleic Acids Research
(2007,
2013,
2016,
2019)
2022),
full papers published on the World Congress of Genetics Applied to Livestock
Production (WCGALP, in
2010,
2018,
2022),
and in Oxford journal DATABASE
(in 2023),
representing the milestones in the course of the
QTLdb development. The QTLdb has been listed by the
NAR Database Collections,
DataCite,
LabWorm,
FAIRsharing,
OMICtools,
AgroPortal (France),
DatabaseCommons,
National Ag Libriary (AgData Commons)
and others.
- What are the main differences between QTL and association mapping?
The main differences between QTL and association mapping are: (1) the methods. They
are both to establish links between certain trait observations and genome locations,
however, the former involves hypothetical points along a chromosome that form an
array of neighboring points providing support for localization of a link under
certain statistical thresholds, and these "neighboring points" ("clusters" if you
wish to call) are found in inheritable patterns in a family (pedigreed analysis).
(2) the level of resolution. QTL analyses can resolve the locations of a link in
terms of chromosomal segments with sizes in terms of centimorgan (cM) (which
translate into several million base pairs).
- What animal species are currently included in the QTLdb?
The Animal QTLdb is designed to house QTL results from multiple livestock
species. The database was originally developed to house pig QTL (2005).
Subsequently, QTL data from cattle and chicken were added (2006).
From 2007 to 2010, Jill Maddox's group started to curate sheep QTL into a
copy of the Animal QTLdb installed at The University of Melbourne, Australia (It
was migrated back to Iowa State University in 2010). Rainbow trout was added
in 2011, horse was added in 2013, Catfish was added in early 2016,
and Goat was added in late 2020, to the multiple species family served by
the Animal QTLdb.
QTL from other animal and aquaculture species will be added in the near future when
possible. This is to serve our long-term goal of assisting comparative QTL studies.
- What are "flanking markers" and what do they represent?
 There are different ways to determine a detected QTL is significant
enough to be "real". Permutation test is one of those popular ones used
by many people. According to Lander and Kruglyak (1995), a suggestive
linkage is expected to occur one time at random in a genome scan and
has an estimated minimum LOD score of 2.0; A significant linkage is
expected to occur 0.05 times at random in a genome scan and has an
estimated minimum LOD score of 3.4 (in real life the "cut-off" LOD scores
may vary depend on actual permutation tests). Therefore, in an ideal
situation, a QTL may be peaked by one marker and flanked by 2 pairs of
markers (see Figure).
There are different ways to determine a detected QTL is significant
enough to be "real". Permutation test is one of those popular ones used
by many people. According to Lander and Kruglyak (1995), a suggestive
linkage is expected to occur one time at random in a genome scan and
has an estimated minimum LOD score of 2.0; A significant linkage is
expected to occur 0.05 times at random in a genome scan and has an
estimated minimum LOD score of 3.4 (in real life the "cut-off" LOD scores
may vary depend on actual permutation tests). Therefore, in an ideal
situation, a QTL may be peaked by one marker and flanked by 2 pairs of
markers (see Figure).
In the QTLdb we try to use flanking markers A1, A2, B1, B2 when
they are available.
- What is Trait Ontology and how is it used in QTLdb?
Livestock production traits are sets of animal phenotypes described for
their nature, quality, quantity and biological stage. Due to differences
in methods of detection or measurement, scope of description and/or
customs, a trait may be described in several different ways. In order to
compare QTL discovered by different labs with different methods, we have
to make a "standard" way of trait description in order to correctly
compare them. To solve this problem, we introduced "Trait
Ontology" to classify and organize the traits for management with
database.
Ontology is a classification methodology that defines a common vocabulary
in a structured way for useful information sharing. Animal production
traits may be classified in many different ways based on their functions,
features, property, etc. One most useful construct of the trait ontology
is that the animal traits may be classified by how they are measured as
commercial products. In the QTLdb, we use three levels of
controlled vocabulary to describe each production trait: Trait
Class, Trait Type and Trait itself. For their
definitions, see FAQ "Terminology" below.
In addition, complex trait terms may come from a basic trait term being
"modified" by a property, or "descriptor" (in some cases called "qualifiers"),
such as an experimental or environmental factor, to produce an extended
version of the trait term as a new term ("sibling traits" or "trait variants";
see see FAQ "Terminology" - trait concept dissection for
more details.
The classification or dissection of trait concepts helps to share common
understanding of information structure among people or software agents.
- How are public QTL data curated into the QTLdb?
Following are extracted from each publication: Experimental design,
Population structure and design, Testing Model and Methods, Trait names on
which significant QTL are detected, Trait Description and Measurements;
QTL location (Chromosome, Position, 95% CI on the Location), Flanking
markers (A1, A2, B1, B2 and the Peak; see Figure for FAQ #5),
Test Statistics (LOD_score, LS_means, P_values, F_values, Variance), QTL effects
 (Dominance effect, Additive effect), Candidate genes, etc., when available.
Publication title, authors, journal and abstracts are also included.
(Dominance effect, Additive effect), Candidate genes, etc., when available.
Publication title, authors, journal and abstracts are also included.
Take pig data as an example, the QTLdb uses the USDA-MARC pig linkage map (MARC-Map)
as a map reference to show relative locations of each QTL, as the MARC map is the
single largest pig map to date, and its markers are used by most QTL studies for
genome / chromosome scan. When a non-MARC-Map marker is used to describe a QTL,
the actual marker location in the experimental map is interpolated to the MARC map
and the interpolated map locations are stored in the QTLdb.
The flanking or underlining markers on the QTL map are linked to the NCBI Gene DB.
- Can I enter my QTL data into the QTLdb?
Yes. The Animal QTLdb is open to public for data entry and update. One must
apply to be
a curator in order to do so. Being a curator, you will be able to
- keep your data private
- update your data any time
- view your data either aligned to its chromosome or along with other public data
- release your data to public access once you decide so
- withdraw your data for any problem found
- all released public data will be populated to NCBI database automatically
By submitting your data to the QTLdb, your data set will join the other
QTL data set published in the past 10+ years, and subject to within and
cross species comparisons. See paper by Hu et al. ("Animal QTLdb:
Beyond a Repository - A Public Platform for QTL Comparisons and
Integration with Diverse Types of Structural Genomic Information.
Mammalian Genome, Volume 18, 1-4 (2007) for more details).
- I have a large amount of QTL/association data to submit to the QTLdb. Is there an easy way to "upload" them?
 Yes, batch submission of your data is possible for our curators to process
them into the database. There are only a few
steps for doing so. Simply prepare/format your data according to the
the minimum required information guidelines,
then use our data sharing platform to
upload.
Yes, batch submission of your data is possible for our curators to process
them into the database. There are only a few
steps for doing so. Simply prepare/format your data according to the
the minimum required information guidelines,
then use our data sharing platform to
upload.
Please be aware that the uploaded data are subject to inspection and batch
processing. It can be very efficient ONLY IF your data meet the requirements
with little manual curation. It often requires follow-up communications for
our curator to get all needed information before an data entry can be made
final.
- What questions does the QTLdb attempt to address?
The following questions were the initially projected to address:
- What is the chromosomal location for a QTL? Can multiple QTL be
viewed in a "synthetic" manner?
- Is it possible that QTL from different studies be easily compared for
their locations?
- Can all markers underlining a QTL be shown and marker information
easily retrievable?
- What are the significance values for each QTL, with what method for
detection?
- Have any other phenotypic traits been mapped to the chromosome
segment that my QTL appears to fall into or is part of it?
- What percentage of phenotypic variation is associated with each QTL?
Is the effect dominant or additive?
- How is the possibility that markers flanking a QTL may be matched to
sequences in a public database for data mining or annotation?
As we build up the QTLdb, we find that the utility of the QTLdb can
extend beyond what we originally anticipated. Efforts are continually made
to add more functionality to the utility of the QTLdb.
- What functionality does QTLdb offer?
The animal QTLdb offer a number of functions for user to easily retrieve, compare
and synthesize QTL information.
By searching or browsing the QTLdb, one can
- Find all QTL on one chromosome
- Find all chromosomes that bear QTL for the same trait
- List all QTL from a particular publication
- Find all markers underlining a QTL
- Find DNA sequences associated with certain markers
- Use GeneDB to further search for candidate genes by comparative maps
- Find experiment details in brief for a given publication
- Find all parameters describing a QTL, as well as test statistics
- Find all associated genome features (SNP, BAC, Genes, Transcripts, etc. - available since 2006).
- Meta-analysis of QTL for a single trait on a chromosome (available since 2010).
- ... more to come as we are continuously developing the QTLdb tools.
The Figure on the right shows an example of multiple QTL identified by
different studies map to pig chromosome 3. With further details, a user can
synthesize a picture of his own on the most promising chromosomal region
where best candidate gene for a trait may reside.
- How to access the information in the QTLdb?
The QTLdb web interface is designed to be easily accessed by search and
browse. Each searched or browsed resulting information is again dynamically
linked for further search or browse. In this way users can quickly find
information from the QTLdb with multi-directional information traverse.
The following paths seem daunting to read but each is at only a couple
mouse-clicks away:
- Draw Single Trait QTL on Multiple Chromosomes
 | Go to Search page, input a keyword
 Click "GO"
Click on your trait
Click on "Find all QTLs" Click "GO"
Click on your trait
Click on "Find all QTLs"
|
- Draw Multiple QTL on Single Chromosome
|
| Go to the Browse page
Click on your chromosome
|
- List all QTL from a particular publication
|
| Go to Search page, input a keyword
Click "GO"
Click on "List QTLs"
|
- Find a pig QTL in NCBI Gene Database
|
| Search or browse to a QTL map
Click on a QTL symbol
Clink on "GeneDB"
|
- Find DNA sequences associated with certain markers
|
| Search or browse to a QTL map
Click on a marker name
Click on "UniSTS" link above the marker name
Click on "GenBank Accession" link
|
- Find experiment/ publication details that produced a QTL
|
| Search or browse to a QTL map
Click on a QTL symbol
Experiment detail in brief is in upper right box
Publication detail is in the lower right box
|
- Find all locations that QTL for a trait may have been mapped to
|
| Search or browse to a QTL map
Click on a QTL symbol
Click on "Trait Name"
Click on "Find all QTL on this trait"
|
- Find related traits from a known QTL trait
|
| Search or browse to a QTL map
Click on a QTL symbol
Click on a "Trait Name", or "Trait Type", or "Trait Class"
Choose from returned trait ontology list other traits to search further
|
 - What structural genomics information are aligned in the QTLdb and how to access them?
Thanks to many collaborators who provided a number of useful structural genomics
information for aligning to the QTL maps (Acknowledgement are on each
respective web pages). These data include radiation hybrid (RH) maps, BAC clone
finger-print contig (FPC) maps, SNP maps, consensus linkage maps, genome maps,
etc. For example, 6,500+ cattle SNPs and 1,300+ pig SNPs were aligned to respective
QTL maps via RH to human comparative maps. 4,528 new porcine microsatellites from
the Sino-Danish Pig Genome Sequencing Consortium were aligned to the pig QTL maps
(see following table for a summary).
Table 1. Data alignment status summary
| Species | Genome map | RH map | BAC FPC | SNPs | Microarray Elements | Human map |
|---|
| Affy | Oligo |
|---|
| Pigs |  | | | | | | |
| Cattle | | | | | | | |
| Chicken | | - | | | - | - | - |
| Horse | | - | - | | - | - | - |
| Sheep | | - | | | - | - | - |
| Rainbow trout | - | - | - | - | - | - | - |
(With reference to paper by Hu et al., "Animal QTLdb: a livestock QTL database
tool set for positional QTL information mining and beyond. Nucleic Acids Research,
2007, 35 [Database issue]: D604-D609.). Note: With
added function of GBrowse that we implemented in
October 2008, QTL alignments to more genome feature are available.
See FAQ #19 for more details.
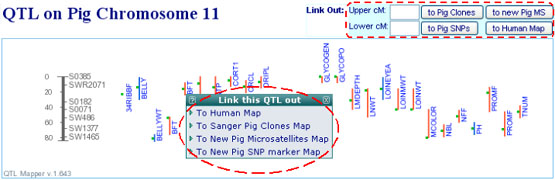
All aligned data can be accessed via either pop-up links or web forms on the
"chromosome view" page of the QTLdb (see Figure below). Users can bring a QTL
region (or interested map locations) across the aligned maps to serve the
purpose of data mining, by using either the QTL bars or the web forms where map
locations in cM must be provided.
Please be aware that more data types are continually being added, and data updates
are actively going on. Don't be surprised if you see things new.
- Which trait(s) are found having more QTLs?
Backfat, Loin-eye area and Meat Color-L are the top three pig traits having
highest number of QTL reported. Body weight in chicken has a dominant number of
more QTL than other traits. Fat yield, milk yield and twinning are the three top
cattle traits that QTL are measured for. For more, see respective species QTL
database "summary" for details.
- There are so many QTLs on a chromosome. Is there an easy way for me
to narrow down the scope to the traits I am more interested? e.g. Can I view my
selected sub-sets of traits?
Yes. There are two added features on the chromosome view of the QTLdb for you to
easily view your interested traits: (1) all traits found on a chromosome are listed
in a new pull-down menu below the chromosome graph, from which you can click to
select the trait you wish to see; (2) all trait name first initials are also listed
at the same spot, with which you can simply click the initials to see all traits
started with that initial.
On the top of the chromosome view screen, there is a "Search for QTL" search box.
Within this search box, you can put in multiple trait symbols, delimited by a
space, to get them all at once to a chromosome view. Note that wild card (*) are
allowed for partial non-specific matches.
- Are data within QTLdb static?
No. The Animal QTLdb as an online database tool being kept up to date with most
current data curated from various resources in public domain. Since its first
release in May 2004,
56 release have been made as of Apr 24, 2025. There are more than just new data additions in each release. For details, see #27
"What's involved in a release", and Animal QTLdb Releases
History.
If you see any new data that has not been included in the QTLdb, please
drop us a note with the source of the publication - we will curate it into
the database as soon as we can get around. Or better yet, you can
register to become a QTL data curator for the QTLdb yourself. In this way you
can enter your data, update your data, and also use the curator tools as a research
platform (see below).
- Are QTL_ID within the QTLdb stable?
Yes. A QTL_ID is assigned as a unique identifier when a QTL is entered into the database.
Once the QTL is entered, the ID becomes permanent. i.e. Even if the QTL is deleted, modified,
or becomes obsolete, the ID cannot be re-used.
When the QTL data is synchronized to NCBI GeneDB, NCBI assigns each QTL a "Gene ID",
which is also permanent. The QTL_ID record goes along with the Gene ID, and displayed as:
Primary source - AnimalQTLdb:#### (QTL_ID). For deleted
QTL data, NCBI site will show "DISCONTINUED: This record was withdrawn by the AnimalQTLdb".
(2022 update: NCBI seems to have ceased assigning QTL "gene ID"s since some time ago.)
- I wish to find a cytogenetic band region of interest for QTL, how can I do that?
This has been deprectaed:
The QTLdb is based on linkage maps. Before we may add the cyto-genetic band
alignments to the linkage maps within the QTLdb, users have to make that
alignment with other tools, such as the Arkdb
(http://www.thearkdb.org/anubis),
i.e. translate your cytogenetic band locations into linkage map
locations, and then come to use the QTLdb to look for QTLs. In the Arkdb,
you wish to build a within-species comparative map between the "Cytogenetic"
map and the "USDA-MARC_v.2" map on the same chromosome.
(see updates below)
We have added cyto-genetic G-band chromosome drawings to the QTL maps for cattle,
chicken, pigs and sheep as of November 16, 2010. The cyto-genetic chromosome maps
and linkage maps are aligned side by side, so that you can visually find cytogenetic
band locations where your interested QTL is likely to land. Please note that the
alignment is scaled to fit the chromosome length, therefore the band to cM/bp
locations are only approximate. Use your best visual judgment plus more evidences
if there are any, to assist you when it comes to fine localizations.
Chromosomal banding graphs for goat are introduced in 2020.
- I wish to "zoom in" to examine a local region of my interested region, can I do that? how?
The QTL map does not have an intuitive "zooming" feature but offer users to choose
the size of the map to view. The size options are listed by a pull-down menu
selection on the top tool bar. On a "very large" scale, users can see all details
of the map at highest marker densities.
Also, combining the use of "Marker density" pull-down menu, you can see more markers
in a larger picture, to achieve the "zooming" effects.
- Some chromosomes have awful lot of QTL that the chromosome view becomes a very wide picture (extends way out of computer screen to the right), making it hard to compare some alignments. Is there any way I can see a more manageable view?
On the "chromosome view" of the QTL, there is a "Display QTL" search box in the top
tool menu. If you type the QTL abbreviations of your interests and click on "Go",
the database will return you a new chromosome view with the QTL of your choice only,
making it more effective for you to make comparisons.
- There are recently available genome sequences for cattle, chicken, and pigs. Has Animal QTLdb been made accessible to them? Which genome build version are used?
Yes. We have built in a function to convert (see FAQ #23) all QTL
locations (cM) on the linkage
maps to genome maps (Mbp), thus made it possible to align all QTL on respective
genomes on their most recent genome builds.
- For genomic mining of a QTL region, we often need to align a
QTL against its genome for underlining genes. Is it possible in the QTLdb?
Yes it is possible.
Previously, we aligned some genomics features such as SNPs, microarray elements,
microsatellites and RH map markers against QTL in terms of their genomics locations,
within the QTLdb. (Reference to FAQ #13)
In October 2008, we have implemented GBrowse (GBrowse is deprecated; now
replaced with JBrowse) for QTL alignments against multiple
genomic features. Now we are able to align the QTL locations against all genome
features stored in Genbank, such as locations of transcripts, mRNA, CDS, Annotated
Repeats, etc. We also custom add more elements for alignment. The most recent
addition to the alignments is the 60K SNP chip elements for cattle and pig.
The link to Jbrowse view can be found in the Animal
QTLdb main pages for respective QTLdb species, and at the
JBrowse directory page: https://www.animalgenome.org/jbrowse/.
If you have your own set of genes and wish to see what QTL/association is/are aligned
them, as long as you have their genome coordinates of your gene, you can do so:
(1) Create a GFF file with your own data, in a tab delimited 9-column plain
text file, as in:
Chr.4  Source  FeatureName  106510877  125474284   .   .   .   my_ID=49;Name="FUS1"
Chr.4  Source  FeatureName  107478402  107478893   .   .   .   my_ID=51;Name="FUS2"
.....  ......  ...........  .........  .........   .   .   .   ....................
(2) Click
 Add your own tracks towards the
bottom of your GBrowse page to upload the GFF file you just made, to the GBrowse
window where you may already browse to a chromosome or a genome region of interests.
In case the window is not refreshed, click
Update Image to refresh. Add your own tracks towards the
bottom of your GBrowse page to upload the GFF file you just made, to the GBrowse
window where you may already browse to a chromosome or a genome region of interests.
In case the window is not refreshed, click
Update Image to refresh.
- How accurate is the QTL location alignment to, say, transcript
locations on the most recent genome assembly?
The alignment of genome locations of QTL against that of transcripts or genes
is accomplished by converting the linkage map QTL locations (cM) to its genome
locations (bp) on the most recent assembly build (the updated genome build
version used in the QTLdb can be found
here). This is accomplished with references to available anchoring
markers mapped on both (linkage and genome) maps.
Often, a QTL boundary may not locate exactly by an anchor marker. In such
cases, the relative genome location of the QTL is estimated with an algorithm
taking into account of the distance between the marker and the QTL boundary,
the chromosome lengths of the linkage and genome maps, relative cM versis bp
unit ratio for that particular chromosome, to calculate the offset of the QTL
location relative to that of the anchor marker (interpolate). As such, the
"bp" location of a QTL from its "cM" location is only a rough approximation.
In addition, the sizes of QTL is often on the scale of centiMorgans ("cM"),
which translate into genome maps in terms of a few hundred kelo- or mega-base
pairs. Therefore, large error sizes may be expected on such interpolation.
On the other hand, the error ranges of original QTL reports are already on
scale of "cM", we consider the current "bp" conversion pretty close to their
"real" locations, and provide useful landmarks for structural genome mining.
While we caution users about the accuracy of exact "bp" locations found on the
JBrowse or the downloaded data, we encourage users to re-estimate the QTL "bp"
map locations, when possible, with their own methods/data. Nonetheless, it would
be relatively safe to consider it a range instead of exact "bp" locations.
- Can I download the raw data from the QTLdb?
Yes. Functions have been implemented so that there are multiple ways for you
to download data from the QTLdb. (1) Links for downloading QTL
coordinates (in cM or in bp) within a species can be found on respective species
main pages of the QTLdb; (2) QTL coordinates and related data within a
chromosome can be downloaded from the chromosomal view of a species;
(3) Subsets of QTL data on a chromosome can be downloaded when term
searches are applied to focus the view of your interests.
Several file formats are available for the downloads: (1) Tab delimited plain
text file containing QTL chromosomal locations in cM; (2) GFF files in which
the QTL locations are in bp. The GFF download allows you to use the downloaded
data file directly with other tools that take GFF file as input.
The ways to download QTLdb data are updated on a
data download page.
- I have downloaded some QTL data, and found many identical QTL
(chromosome locations, traits, even publications. Is it possible that they
are redundant curations?
You may want to realize that the downloaded QTL data are only a snapshot of
the data stored in the QTLdb. It depends on how you look at the data -- in some
sense certain information may be "missing" if you scrutinize the data in a
context that require extended information. For example, when you see two QTL
that starts and ends on exact the same locations, your first impression might
be that they are the same. It can be confusion in downloaded data sets since
not all (comments and other loosely related) information are included, in a
GFF download file. Verification of the data with the QTLdb online tools may
be necessary. A useful way to verify if they are really "redundant" to compare
them for all parameters, e.g. experiment methods, analysis methods, test
statistics, flanking markers, etc.
- Were they published in the same paper? -- Sometimes the same author(s) may
analyze their data set with different methods, or re-analyzed their data with
new data additions, and publish the results in a subsequent paper. It is likely
the new results may resemble the previous ones.
- Are their peak locations also the same? Are the peak/flanking markers also
the same? (This would be an immediate indication that they are from different
tests/analysis).
- Are they for the same trait? Any trait variations on respective reports? --
Please note that there are many trait variations, e.g. ADG during gestation and
ADG in feedlot; Fat content measured in loin and measured in ham; etc. In the
QTLdb, "similar" QTL representations may all follow a "super trait" name for
categorized comparisons (see FAQ #129 "Terminology" for more
details).
Cases exist where the same set of experiment data were analyzed with two different
statistical methods, each was flagged with their significant p-values. In this case
the information was only noted in "Comments" of a curation (found in QTL details).
It is practically useful if you bring two suspicious QTL into respective QTL detail
views for a side-by-side comparison. (Hint: formulate your URL to view details directly
without having to go through browsing the web layers, i.e. put those two parts
together:
"
https://www.animalgenome.org/cgi-bin/QTLdb/BT/qdetails?QTL_ID= " +
" QTL_ID ", leaving
no space, as in "
https://www.animalgenome.org/cgi-bin/QTLdb/BT/qdetails?QTL_ID=4415 ".
Feel free to contact us if you cannot resolve your confusions.
- Are there any tools available that can help me to do some meta-analysis?
Yes, we have recently (October, 2010) developed a set
of QTL meta-plot tools to help users performing simple meta-analysis on the fly. To use
the tool, briefly, users will first need to select/browse to a species/chromosome of
interest, then search for a trait or QTL to examine. When only the QTL for a single
trait are displayed, a "Show MetaPlot" link appears (in the lower portion of a QTLdb
chromosome view). When this link is clicked, the meta-plots will be displayed to the
right of the QTL graphs on the QTLdb chromosome view. See this
tutorial for more details.
- What is an Animal QTLdb Release? What is involved in a release?
A "Release" of the Animal QTLdb is a process in which the new updates of the database
on its content (data), functions (database tools), and utilities (improved user
accessibility to data and data analysis) are made available. Each release usually
comes with a description of what's new on the release (see
Releases History for examples). Upon each release, updated information are
proliferated to the following sites in 5-10 days:
- What are Animal QTLdb data alliances?
An Animal QTLdb Data Alliance is a genomics database partner with which we share
data and make user experiences exploring these at each site seamlessly. Our current
data alliances include:
NCBI Entrez GeneDB,
Ensembl,
Reuters Data Center,
and UCSC.
Newly released QTL/association data are exported to them timely. Users can fully
explore the power of their great tools for QTL and association data mining or
exploration in the context of genome features.

User contributed
|
- I have my data analysis on an older version of a genome assembly, is it possible to transfer QTL coordinates on the current assembly to the older assembly? How?
Yes. While you may device your own ways to map genome coordinates of your interests
from one genome assembly version to another, there are tools to help you to do so.
These tools include but not limited to,
UCSC liftOver,
NCBI Remap,
Ensembl API, CrossMap, among others.
Sometimes, the flanking QTL genome coordinate pairs may not work out nicely with some
tools. A trick used by Shangang Jia
was to use only one side flanking location of a QTL to try out the LiftOver. You may
like to repeat the same procedure in a separate run with flanking location of the other
site, then assemble the results.
- Why sometimes I find QTL coordinates are not the same on your JBrowse and your web web site?
We realize that while we commit our diligent works to keep the QTL data current and
updated, we should also keep users informed with possible gaps from the steps how we
update our data.
The discrepancies you observe are most likely from our updates procedures in which the
estimated genome coordinates are maintained (e.g. estimated bp from cM locations is
subsequently corrected by actual SNP map coordinates when a SNP is present.)
We do also realize there are time gaps between our data updates on the QTLdb, data
download sites, JBrowse sites, although we try to keep the gaps minimum
as possible. A general advice is that the online Animal QTLdb web site reflects the
most current data updates, i.e. data on other sites are propagated from here.
- Is there a better way to search QTLdb by multiple criteria for a literature without involving complicated multiple web form fields?
Yes, it is possible. The "publication search" within the QTLdb take a formulated search
string that includes several lines of information. For instance, in this example:
title:Carcass; authors:Casas; year<2003
Multiple criterion search string may be separated by semi-colon
(";"), and
each criteria is led with a key word separated from the search string with a colon
(":").
Supported key words include 'author',
'title',
'journal',
'abstract',
'text',
'institute',
'affiliation'
(actually only the first 4 letters should be sufficient).
The only exception is "year", which can be in the form like:
"year<1999",
"year=1999",
or "year>1999".
- I wonder if I can download the QTL/association data based on the trait classes? For example, health traits?
Surely you can. Actually, there are multiple ways to achieve that.
(1) Try a trait search under “Search and Analysis” tools of a species; the search
will bring up a trait-centric view of your search results. Fine tune with
improved keyword combinations on the same results page to get what you expected
to find, then scroll down to the bottom of the page for a “Download” button.
(2) Download all data from a species (on a species page, upfront), choose gff
format to download; bring the data to an Excel sheet to expand column 9 into
multiple columns with semicolon “;” as the delimiter. On the resulting page
you can sort all data by traits (or whatever) to get what you need.
- Is there any license term on the QTLdb? (e.g. Open Data license or waiver)
The data is made freely available for anyone to use as they want. For
example, NCBI, UCSC, Ensembl and Thompson Reuters ingest the database and
make it available via their sites. We have left it up to the user as to
what they want to do with the data.
We generally ask folks to cite on the publications that we have on the
site.
- Can I download GWAS or eQTL data from the Animal QYLdb?

You can filter your downloaded GFF formatted data to obtain what you need:
The 3rd column has the "data type", in which there are two parts of information,
"trait types" and "link types" placed together in the format "traitType_linkType",
such as:
- Reproduction_Association
- Milk_Association
- Exterior_Association
- Reproduction_QTL
- Reproduction_eQTL
- etc.
Note the second part "link types" can be one of the following: QTL, association,
and eQTL, where "association" refers to SNP associations, i.e. mostly GWAS data.
You can filter your data sheet on that information to get what you need.
- What are gene-centric, trait-centric, and SNP-centric QTL/association information?
The gene-centric, trait-centric, and SNP-centric information views are dynamic web
pages showing QTL/association data gathered surrounding each of these entities.
The gene-centric and trait-centric data views were introduced on
Release 34 in 2017; and SNP-centric data view
was introduced on Release 42 in 2020. All those
data views are built in the data format modules of QTLdb search tools.
- How can I find all QTL/associations reported by a publication?
In 2017 we introduced a "permanent record locator" link upon the
Release 33. The record locator link can bring
up a web page with all curated QTL/association data from one specific publication
listed by traits, by genome locations, and by data types (e.g. eQTL, pleiotropies,
epistasis, etc). The link is in the form of an URL:
https://www.animalgenome.org/QTLdb/supp/?t=[identifier_string]
where the "identifier string" is assigned by the QTLdb and is stable. It
can be retrieved by the data owner or curator. The link can be used by the authors
to refer to their published data, to provide proof of evidence of data entry at
the Animal QTLdb to journal editors/manuscript reviewers, and to serve other
purposes such as supplementary data pointer of a publication, or a link from their
web sites.
- How can I quickly locate a QTL/association with a QTL_ID without
going through the troubles looking it up in each of the 8 species in QTLdb?
In 2020 we introduced dbxref links to each QTL/association
record in the QTLdb on Release 43.
The syntax for the specific URL link is in the form of
https://www.animalgenome.org/QTLdb/q?id=[QTL_ID]
where "QTL_ID" is a numeric QTL id; found in QTLdb data downloads
or when browse the QTLdb web site. It's often used by web tools, API
tools, or database dbxref references.
 There is a section for "Animal QTLdb" in the
GeneOntology db-xrefs list to describe the syntax to use in order
to establish stable links to QTLdb.
There is a section for "Animal QTLdb" in the
GeneOntology db-xrefs list to describe the syntax to use in order
to establish stable links to QTLdb.
The Animal QTLdb and CorrDB are also registered at the Identifiers.org.
Search for QTLdb at
https://registry.identifiers.org/ for how to use that service.
- I am confused by the different numbers of data counts on different genome builds of a species, often it's fewer than the total number on a database release. Furthermore, Why the data counts on a genome build changes on a recent release compared to that of earlier releases?
All original QTL/eQTL/SNP association discoveries were made on various genome maps available at the time the experiment was carried out. One of the works we do at the QTLdb is, after the data are curated into the database, to (re)map them to a currently used genome assembly or assemblies using available official SNPs anchoring them. The SNP mapping information on a genome assembly is from the dbSNP (maintained and released periodically by the European Variation Archive (EVA) at the EMBL-EBI). We do experience cases where fewer QTL be lifted to the same assembly because less SNPs are mapped from a new dbSNP release. For the same reason the number of curated QTL/association data that can be mapped to each assembly also vary.
Starting from QTLdb Data Release 53, we also include copies of originally curated data with or without SNP information. Users are encouraged to do their own SNP mappings using a method they trust.
- (2024) Why the "QTL" sizes are only a few base pairs in the current data downloaded from the QTLdb?
"QTL" is a classical name for loci that trait variations may be statistically
linked to. Such data may include but not limited to QTL derived from interval
mappings, GWAS analysis, or many other methods. SNP associations are typically
a "point" on a genome. A minimal of 4 bp span is mainly for the sake of data
visualizations on a genome browser.
Check up the QTLdb release histories, to find more
about how things have evolved.
- Terminologies
- Base Traits - See "Trait concept dissections"
below for details.
- Clinical Measurement Ontology
(CMO) - is designed to be used to standardize morphological and physiological
measurement records generated from clinical and model organism research and
health programs.
- Complex Traits - See
"Trait concept dissections" below for details.
- aseQTL: -
allele-specific expression quantitative trait loci, may result from
cis-regulatory SNPs.
- eeQTL: - Exon
expression QTL - study the genomic variations that are associated with
splicing regulation. A stringent criterion was adopted to study gene-level
eQTLs and exon-level eeQTLs for both cis- and trans- factors. (Guan et al,
2014).
- eQTL/geQTL: -
(gene) expression Quantitative Trait Locus, denotes the relationship between
transcription and SNP. An eQTL is a locus that explains a fraction of the
genetic variance of a gene expression phenotype. It essentially performs a
GWAS using the expression value of the gene as a trait. It usually contains
locations where there is polymorphic expression (Most people do some form of
cis-eQTL analysis using only SNPs within some kMB of the TSS or TSE. Often k=0.5MB).
- eQTL: - "eQTL" is
abbreviated from "expression QTL". It's a locus that explains a fraction of
the genetic variance of a gene expression phenotype. eQTL is usually detected
from association between genotype and RNA expression levels, which can be
resolved to genes mapped to the genome, representing gene-eQTL. The use
of selective transcriptional profiling using available information on
individual quantitative traits can link an expression pattern to traits,
resulting in trait-eQTL representations.
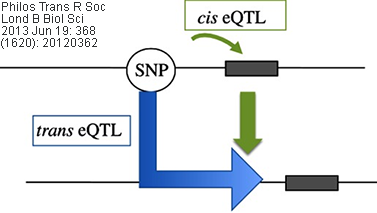
Cis/Trans eQTL: eQTLs mapped to the approximate location
of their gene-of-origin are referred to as local eQTL (cis eQTL). In contrast,
those that map far from the location of their gene of origin (often on different
chromosomes) are referred to as distant eQTL (trans eQTL). Usually, the
use of these terms are best reserved for instances when the regulatory mechanism
(cis vs. trans) of the underlying sequence has been established
(source: wikipedia.org).
Related/corresponding terms include cis-acting/trans-acting,
cis-SNP/trans-SNP, etc.
- Indel - Insertion or deletion (Indel, also Ins/Dels) of bases in the genome of an organism. (also see SNP below)
- mQTL - Metabolomic Quantitative Trait Loci.
- mQTL/meQTL - denotes the relationship between methylation and SNP.
- sQTL - Caused by SNPs that alter splicing or alternative splicing (AS), such as by changing the sequence-specific binding affinity of splicing factors to the pre-mRNA.
- DOI - Digital Object
Identifier, a unique alphanumeric string assigned by a registration agency (the
International DOI Foundation) to identify content locations on the Internet.
This is useful in the QTLdb for direct links from curated QTL/association data
to the original publications.
- dbxref - The
dbxref or db_xref is a database qualifier used in a
method to serve as a stable vehicle for between-database links of records. It
often takes the form of a unique identifier built into a stable URL without any
space. This is often used by web tools, API tools, or database dbxref references.
- Epistatic QTL - refers to to observations that
multiple QTL/associations have interactions in terms of a combined effect on
traits they influence.
- Flanking markers - Genetic markers that boundary
either sides of a hypothesized QTL. A flanking marker can also represent the
level of statistical significance when the QTL is detected.
( see FAQ #5 above for more details )
- LocusLink - It was a deprecated
NCBI database
that organizes information around genes to generate a central hub for accessing
gene-specific information for multiple species.
It provides a single query
interface to curated sequence and descriptive information about genetic
loci and presents information on official nomenclature, aliases, sequence
accessions, phenotypes, EC numbers, MIM numbers, UniGene clusters, homology,
map locations, and related web sites.
The Animal QTLdb data were first started to be synchronized to the LocusLink in 2004.
Following the
LocusLink transition to "Gene"DB that started in 2005, the data synchronization
was re-established in early 2009 to the NCBI GeneDB.
- Livestock Product Trait Ontology (LPT) - is a controlled
vocabulary for the description of traits (measurable or observable characteristics)
pertaining to products produced by or obtained from the body of an agricultural
animal or bird maintained for use and profit.
- Pleiotropic QTL - Refers to observations that a
QTL/association locus has influnces on two or more seemingly unrelated phenotypic
traits.
- Quantitative Trait Loci - Genetic loci contributing to
quantitative traits variations. ( see FAQ #1 above for more info.)
- Sibling Traits - See "Trait concept dissections" below
for details.
- SNPs - Single Nucleotide Polymorphisms, a genomic variant
at a single base position in genomic DNA sequences, are the most common type of
genetic variations. Identified SNPs in a genome can be in terms of hundreds of
millions. In humans, a typical genome differs from the reference genome can be
at a few million sites, more than 99.9 of which consist of SNPs and short indels.
Indel frequency tends to be markedly lower than that of SNPs, except near highly
repetitive regions, including homopolymers and microsatellites.
- Statistics test parameters
- False Discovery Rate (FDR) - is the number of
false positives in all of the rejected hypotheses, i.e. the rate of type I
errors in null hypothesis testing when conducting multiple comparisons.
- Posterior Probability of Association (PPA)
- can be thought of as the Bayesian analogue of a p-value obtained,
interpreted directly as a probability, irrespective of power, sample size or
how many other SNPs were tested. (Matthew Stephens* and
David J. Balding, Bayesian statistical methods for genetic association studies.
Nature Reviews - Genetics, 2009; 10:681).
- Posterior Probability Inclusion (PPI)
- In Bayesian. the proportion of samples in which at least one SNP from a given window was
included in the model with a non-zero effect, is used for significance test in
pleiotropy tests (Garrick DJ, Fernando RL, "Implementing a
QTL detection study (GWAS) using genomic prediction methodology". Methods Mol Biol.
2013;1019:275-98).
(This is also known as PIP.)
- iHS - Signature of Selection test: Log ratio between two
integrated haplotype homozygosity scores
- CLR - Signature of Selection test: multi-locus composite
likelihood ratio test.
- XPCLR - Signature of Selection test: Cross-population
composite Likelihood ratio test (multilocus allele frequency differentiation between
two populations).
- EHH - Signature of Selection test: Extended haplotype
homozygosity
- XPEHH - Signature of Selection test: Cross-population
extended haplotype homozygosity
- Fst - Fixation index (FST) is a measure of population
differentiation due to genetic structure. It is frequently estimated from genetic
polymorphism data, such as single-nucleotide polymorphisms (SNP) or microsatellites.
Developed as a special case of Wright's F-statistics, it is one of the most
commonly used statistics in population genetics.
- Suggestive linkage - ( see FAQ #5 above )
- Significant linkage - ( see FAQ #5 above )
- Trait modifiers - See "Trait concept dissections" below for details.
- Trait Ontology - ( see FAQ #6 above )
- Trait Class - A trait hierarchy term used in the Animal
QTLdb/CorrDB trait management system. It's usually a generic name to refer to a category
of traits that are similar in terms of a concept (production traits), or a function
(reproduction traits; disease resistance traits), or a process (growth traits), or
traits under a concept (meat quality traits), etc.
- Trait concept dissections - In conceptual terms, an
observed "trait" may be a result of mixture of multiple information, such as a
body part measurement with given time, duration, biological stage, anatomical dissection,
and/or instrument. Usually we can them "complex trait". Complex traits can usually be
dissected to several parts by its basic representation and its extended representation
of objects.
A trait term may be “modified” by a property, "qualifiers" (using "descriptor" words),
such as an experimental or environmental factor, to produce an extended version of the
trait term as a new term. Examples of such extensions are intramuscular fat content (IMF)
measured in different muscles (e.g., gluteus medius, longissimus) or using different
methods (e.g., ultrasound, petroleum ether extraction); or milk yield (MY) measured daily
or over the entire lactation period, or compared between the first and second lactations.
For these examples, IMF and MY are the base trait, the additional
properties are modifiers, and the extended names of the base traits plus
modifers are trait variants. In order to compartmentalize the modifier
terms for a controlled list, we introduced qualifiers using
descriptor words, to further define the use of a modifier. This effectively
partitioned the “modifiers” used previously in "sibling traits" into two
parts: modifiers and qualifiers
(REF).
| complex trait | = | base trait + modifiers + qualifiers |
| |  sibling traits sibling traits |
| | trait variants |
Note, "base trait" names are usually corresponding to, and can be linked directly
with, terms of a trait ontology (VT, PT, or CMO) term.
- Trait Name - A trait hierarchy term used in the Animal
QTLdb/CorrDB trait management system. The names are usually defined to reflect
the nature, the conceptual representation, and the measurements (locations, time,
methods, units, etc). e.g. 24hr post mortem pH. Each trait is distinguished
by its characteristics, methods of measurement, and product merit.
- Trait Type / SuperTrait - A
trait hierarchy term used in the Animal QTLdb/CorrDB trait management system. It
concepturally represents a collection of similar traits that share the same type
of specified property or feature(s), general physical or chemical property of, or
the processes that lead to, or types of measurements that result in, an observation,
regardless possible naming variations by measuring times, locations or methods
("trait modifiers"). e.g. Meat Color.
- Trait Variants - See "Trait concept dissections" above
for details.
- Vertebrate Trait Ontology (VT) - is a controlled
vocabulary for the description of traits (measurable or observable characteristics)
pertaining to the morphology, physiology, or development of vertebrate organisms.
|


