
Questions and Answers
"CateGOrizer: A Web-Based Program to Batch Analyze Gene Ontology Classification Categories."
- What is GO?
- What is CateGOrizer?
- What is DAG?
- What this tool is designed for?
- How does it work for me?
- How are the results presented to me?
- What's the file format for upload?
- Can I use my own classification method?
- How are ancestral classifications counted?
- What is Transitive Closure?
- What are the "consolidated single occurences" and "accumulative all occurences"?
- Why my sum of the counts is more than the total GO terms in the input?
- What are "counted terms" and "odd terms"?
- How to properly interpret my results? Any hints to make better use of the tool?
- Is there a way to improve my counting results?

- Now there is a section below the job submission windows stating that I must "Type the letters from the image into the box next to it so that I know you are not a robot hacker". What does it mean?
- How can I export the results other than copy-and-paste?
- What does Revigo do with CateGOrizer?
- How may I cite the use of CateGOrizer?
What is GO?
GO is short for Gene Ontology which uses a controlled vocabulary to describe gene and gene product attributes in any organism. Gene Ontology describes the basic gene term categories and relationships.What is CateGOrizer?
The CateGOrizer is comprised of several perl CGI programs coupled with a MySQL DBMS that stores the GO terms DAG data (pre-computed terms associations).What is DAG?
 DAG is short for
Directed Acyclic Graph, a directed grap with no directed cycles, that is,
for any vertex v, there is no nonempty directed path that starts and ends on v.
DAGs can be considered to be a generalization of trees in which certain subtrees
can be shared by different parts of the tree. In a tree with many identical subtrees,
this can lead to a drastic decrease in space requirements to store the structure.
The Figure on the right shows a simple DAG structure (a) and how the the distances
between terms may be calculated (b).
DAG is short for
Directed Acyclic Graph, a directed grap with no directed cycles, that is,
for any vertex v, there is no nonempty directed path that starts and ends on v.
DAGs can be considered to be a generalization of trees in which certain subtrees
can be shared by different parts of the tree. In a tree with many identical subtrees,
this can lead to a drastic decrease in space requirements to store the structure.
The Figure on the right shows a simple DAG structure (a) and how the the distances
between terms may be calculated (b).
What this tool is designed for?
Originally this tool was created to meet the needs in large scale EST analysis where people wish to get a rough idea how their annotated ESTs are distributed in different gene categories. This tool also finds its utility in understanding microarray data where large number of up/down regulated genes may be quickly categorized to show the trends of changes in terms of which gene classes are changed most. This can be used in combination with, for example, pathway analysis.How does it work for me?
The program takes input of GO terms (e.g. GO:0007067) in a list format or from an unformatted plain text file, traverse through the GO DAG structure for a parent/child counts, and returns the results on the web. The program also allows user to choose one of the available classification methods such as GO_slim, GOA, EGAD, MGI_GO_slim, ... or GO-ROOT (You can upload your own "slim" classification. However, if you have a relatively stable new "slim" that you don't want to upload every time, or you wish to share with others, we will be happy to add it to the permanent slim list).If you have a large data set and it takes a long time, it will email the user with a URL link to the results.
How are the results presented to me?
The output includes the counts and percentages in a sorted tabular form, plus a pie chart. Shown on the right is a snap shot of the main part of a CateGOrizer analysis results page where the counted GO terms are shown in tabulated form along with a pie chart. The raw GO IDs are also appended below as a reference, separated in "counted" and "odd" groups. Each GO term and GO class in the graph is hyper- linked to AmiGO browser at the GO web site for details (Click on the graph to see a real example).  ( Click on the graph for a larger picture )
In the end, it attaches all counted and "odd" GO terms (no match to any of the parental terms in your "slim") for your reference. In addition, if you click on the counts, it will show you a list of GO terms counted into this category.
What's the file format for upload?
The GO Term files for upload must be in plain text (ascii) format, prefereably laid out as a list, one entry per line, as shown in the following example.GO:0008629 GO:0051241 GO:0007157 GO:0016849 GO:0004383 ... ...
However this format is not strictly enforced because the program is "smart enough" to fish things out if the file is not formated as a single column list.Can I use my own classification method?
Sure you can. Your classification file must be in a plain text (ascii) format, as a one line per entry list, led with GO_ID and separated from its definitions with a tab or space, as in:GO:0009058 biosynthesis GO:0008152 metabolism GO:0009056 catabolism GO:0019725 cell homeostasis GO:0005515 protein binding GO:0005840 ribosome ... ... ... ...
and upload it along with your data as "Your Classification File".How are ancestral classifications counted?
The transitive closure are built in GO database schema and the paths are pre-computed from every node to all of its ancestors, which is equivalent to computing the path from every node to all of its descendents (See reference "ii"). The count of a term into to a parental term is simply the process to find if the path lead its way to the ancestor.What is Transitive Closure?
The relationships between GO terms are not in simple tree structure (although sometimes partial structure may appear to be like hierarchies), but are organized in structures called directed acyclic graphs (DAGs). For example a GO term may have more than one child, and/or have more than one parent (See reference "i"). The transitive property of numbers states that if A = B and B = C, then A = C. Derby applies this property to query predicates to add additional predicates to the query in order to give the optimizer more information. This process is called transitive closure.

What are the "consolidated single occurences count" and "accumulative all occurences count"?
It is common that multiple paths exist between an ancestral/parental term and a child term. Consolidated single occurences count is that we count only once when multiple paths are found between an ancestral term and a child term. The Single occurences count is often used to get an idea how the child terms are "classified". It can often effectively avoid an inflated total counts. In contrast, when each and all paths between an ancestral term and a child term are accumulatively counted, we call it all occurences count. This can be useful to get an idea how complex the terms are related.Why my sum of the counts is more than the total GO terms in the input?
One may ideally wish a Term belongs to, and is counted into, an ancestor term only once. However in reality this is often not the case. As discussed above, a GO term can trace back to more than one ancestor parents, and therefore the trace of a child term to an ancestor term may form more than one independent path, making a (child) term counted multiple times into an ancestor term. Consider situation where multiple consecutive relationship exists along a path, and such relationship "fork" might happen to any of the element terms, thus the overall sum of counts may appear much "inflated". If such "inflation" is significantly larger than acceptable, one may want to scrutinate the GO Terms in the classification used, see if their representative coverage overlap, and do some necessary manipulations of the counting results to improve the represenation (see answers to the next question).What are "counted terms" and "odd terms"?
Along with the counted results, the CateGOrizer lists the "Counted Terms" and "Odd Terms". The "Counted Terms" are those that are found belonging to at least one of the classes in a given classification method. The "Odd Terms" are not found belonging to any classes in the given classification method. Both groups of terms are listed in a sorted order, with the frequence of a term in the raw GO Term data set placed in parenthesis postfixing each term. This information maybe helpful for users to evaluate how the GO annotations are represented under the given classification method. For example, if there are many "odd terms" to a classification method, it may imply that the method may not be the best fit for the raw data set. Users are encouraged to try out different classification methods or modify the classification to improve the representation of the raw data set. The classification that produce the least number of "odd terms" may be the best for your data set.How to properly interpret my results? Any hints to make better use of the tool?
 As the count of GO terms into each ancestral term is independent of one another,
the counted results may be selectively used, and percentages recalculated as long
as the selected terms represent a well covered spectrum of your scope. This helps
to avoid redundancy, and may make best sense for a particular data set. For example,
in the "GO_Slim" classification, the three main GO classes, "molecular_function",
"cellular_component", and "biological_process", may themselves already constitute
a full coverage of the GO spectrum, therefore overlap with other (child) terms in
the "GO_Slim" in terms of representative coverage. Therefore the counts of these
three terms may be taken out, and the sum of remaining terms can still be taken as
"100%", and the percentages for each term recalculated.
As the count of GO terms into each ancestral term is independent of one another,
the counted results may be selectively used, and percentages recalculated as long
as the selected terms represent a well covered spectrum of your scope. This helps
to avoid redundancy, and may make best sense for a particular data set. For example,
in the "GO_Slim" classification, the three main GO classes, "molecular_function",
"cellular_component", and "biological_process", may themselves already constitute
a full coverage of the GO spectrum, therefore overlap with other (child) terms in
the "GO_Slim" in terms of representative coverage. Therefore the counts of these
three terms may be taken out, and the sum of remaining terms can still be taken as
"100%", and the percentages for each term recalculated.
Is there a way to improve my counting results?
Yes. As shown in the following graph for an example, Comparison of two analysis of one raw GO id data set, showing the importance of properly selecting a classification method. In (a), a "immune class" was chosen as the classification method; while in (b) the "GO slim" was the classification method. ( Click on the graph for a larger picture )
A closer examination at a classification counting results on 3,216 GO terms, showing the importance of carefully selecting a suitable "GO Slim" to use. In (a), three root GO classes: "biological_process", "molecular_function", and "cellular_component" were included in the classification method, which caused much inflation of the total counts due to the overlaps between parental classification terms. In (b), when these three classes were excluded from the classification method, the counts appear to be "more normal".
Now there is a section below the job submission windows stating that I must "Type the letters from the image into the box next to it so that I know you are not a robot hacker". What does it mean?
That means you must manually type the letters you see in the image into the input box next to it before your job may be submitted :-) The reason to enforce this is because nowadays there are cyber-hacker programs on the internet that ubiquitously find and fill any form with information that we usually don't want to see. By enforcing a manual recognition step like this, the computer server will be relieved from being used as a spam information carrier. Thank you for your understanding.
How can I export the results other than copy-and-paste?
In your browser, save the results page ("File" -> "Save page as", or simply Ctr-s) to your computer; Then open the saved file with Excel. You can edit the save the page trimming it down to what you need.
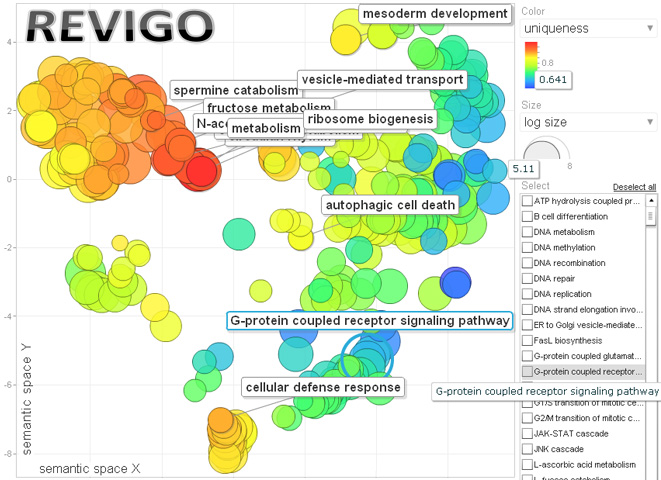
What does Revigo do with CateGOrizer?
REViGO is a free web server by Supek et al. ("REVIGO summarizes and visualizes long lists of Gene Ontology terms", PLoS ONE 2011), that can take long lists of Gene Ontology terms and summarize them by removing redundant GO terms. The remaining terms can be visualized in semantic similarity-based scatterplots, interactive graphs, or tag clouds. The CateGOrizer is now bundled with Revigo for the convenience of users to take CateGOrizer outputs directly to Revigo for a semantic representative subset analysis. Here is an example of its output:
How may I cite the use of CateGOrizer?
Zhi-Liang Hu, Jie Bao and James M. Reecy (2008) CateGOrizer: A Web-Based Program to Batch Analyze Gene Ontology Classification Categories. Online Journal of Bioinformatics. 9 (2):108-112.If you used results analyszed by Revigo, please cite its references in the way recommended on its web site.
If you have any question that are not answered in this FAQ, please feel free to send it to us. It may be a good question that we have addressed but missed. It might be a useful addition for a new entry in this FAQ!
REFERENCES
- The Gene Ontology Consortium (2006). An Introduction to the Gene Ontology. URL: http://www.geneontology.org/GO.doc.shtml, Last modified: February 17, 2006.
- Chris Mungall, (2004). GO Database Schema. URL: http://www.godatabase.org /dev/sql/doc/godb-sql-doc.html, Last modified: April 5, 2004.
- Hu, Zhi-Liang, Jie Bao and James M. Reecy (2007). A Gene Ontology (GO) Terms Classifications Counter. Plant & Animal Genome XV Conference, San Diego, CA, January 13-17, 2007.
- Hu, Zhi-Liang, Jie Bao and James M. Reecy (2008). CateGOrizer: A Web-Based Program to Batch Analyze Gene Ontology Classification Categories. Online Journal of Bioinformatics. 9 (2):108-112.
First draft: April 25, 2006
Modified: August 24, 2006; April 25, 2007; July 31, 2008; May 10, 2010; February 24, 2012 August 10, 2014, February 9, 2015.
By Zhiliang Hu
Associate Scientist
Dept of Animal Science
Iowa State University